
If you can balance an equation but freeze when an AP question asks you to draw what is happening at the particle level, you are not alone. Particulate diagrams (also called particulate models or particle-level representations) sit between the symbolic world of formulas and the real behavior of matter. They are one of the most useful—and most missed—skills in AP Chemistry.
This guide explains what particulate diagrams are, how to build them step by step, and how to avoid the mistakes that cost points on exam day. Everything here is written in plain language so you can use it while studying on your own or with a chemistry tutor online or in person.
—
What Is a Particulate Diagram?
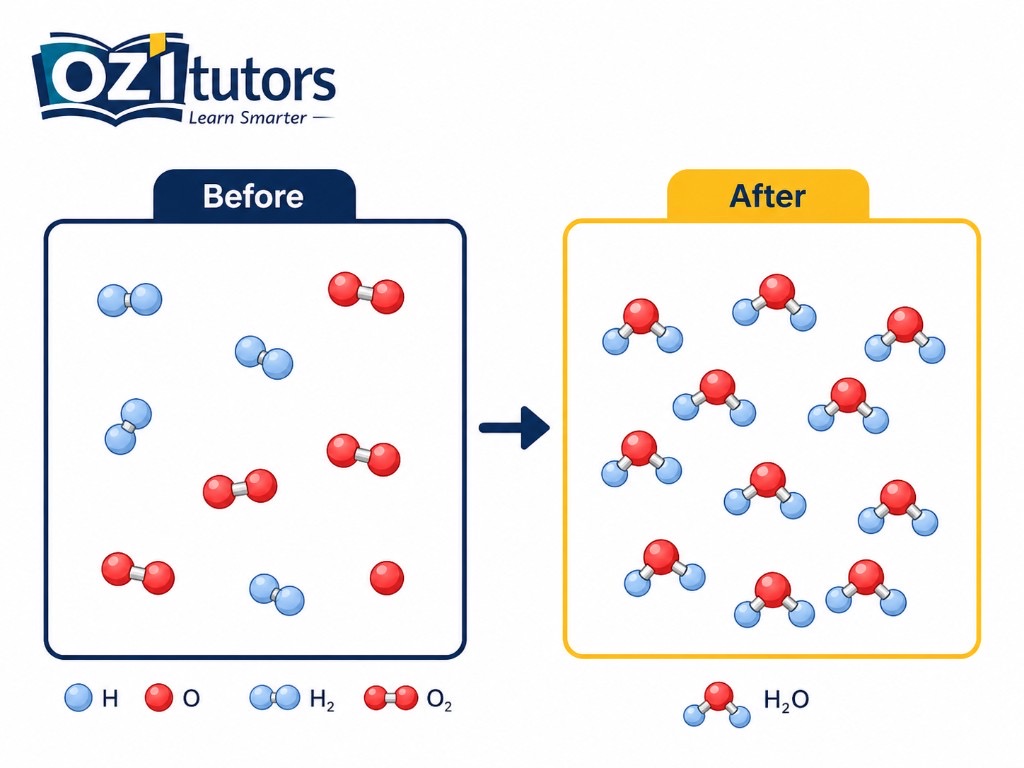
A particulate diagram is a simplified picture of a chemical system showing individual atoms, molecules, or ions and how they are arranged before and after a change.
Think of it as zooming in until you can see separate particles in a box:
- Before the reaction or process
- After the reaction has gone as far as it can
The drawing is not meant to be artistically perfect or to scale. Circles, clusters, and simple shapes are fine. What matters is chemical accuracy: correct formulas, correct ratios, and correct phases.
On the AP exam, particulate representations connect directly to Learning Objective 4.3.A: represent a chemical reaction or physical process with a consistent particulate model.
—
Why Particulate Diagrams Matter
Symbolic equations compress a lot of information into a short line. Particulate diagrams force you to answer questions equations hide:
- Are atoms conserved? Every atom in the reactant side must appear on the product side.
- Are the ratios correct? Coefficients become particle counts.
- Are you showing the right species? Water is a molecule; sodium chloride in solution is ions, not NaCl pairs.
- Does phase make sense? Gases spread out, solids cluster, aqueous ions move independently.
Students who master this skill find stoichiometry, net ionic equations, and even equilibrium easier because they can see what the symbols mean.
—
The Four Rules Every Particulate Diagram Must Follow
1. Start with a balanced equation
Never sketch particles from an unbalanced reaction. Balance first, then translate coefficients into particle counts.
Example
2 H₂(g) + O₂(g) → 2 H₂O(l)
You need two H₂ particles and one O₂ particle before, and two intact H₂O particles after—not two separate H atoms floating beside one O.
2. Conserve every atom
Count each element before and after. If a carbon atom enters as CH₄, exactly one carbon must appear in the products. Missing atoms is the fastest way to lose credit.
3. Draw species the way they actually exist
| Substance type | How to draw it |
|---|---|
| Diatomic elements (H₂, N₂, O₂, F₂, Cl₂, Br₂, I₂) | Always paired |
| Polyatomic ions (SO₄²⁻, NO₃⁻, NH₄⁺) | One grouped cluster unless the equation breaks them apart |
| Ionic compounds in water | Separate cations and anions, not neutral formula units |
| Ionic solids | Ordered lattice of alternating ions |
| Molecular compounds | Atoms bonded into one unit |
A common error is drawing NaCl(aq) as little NaCl molecules. In water, sodium chloride dissociates into Na⁺ and Cl⁻ ions surrounded by water.
4. Match phase behavior
- Gas: particles spaced apart, free to move
- Liquid: close together, no fixed lattice
- Solid: tightly packed, regular arrangement
- Aqueous: ions or molecules separated and mobile in solution
You do not need electron shells or realistic atomic radii unless a question specifically asks for relative size to illustrate a concept.
—
Step-by-Step Method (Use This on Every Problem)
Step 1 — Write and balance the equation.
Step 2 — List every distinct particle on each side with its coefficient.
For AgNO₃(aq) + NaCl(aq) → AgCl(s) + NaNO₃(aq), the net ionic equation is:
Ag⁺(aq) + Cl⁻(aq) → AgCl(s)
Your diagram should show silver and chloride ions combining in a 1:1 ratio to form solid AgCl. Spectator ions (Na⁺, NO₃⁻) may appear unchanged in solution if the question includes them.
Step 3 — Draw the “before” box with the correct number of each particle.
Step 4 — Draw the “after” box by rearranging the same atoms into new species.
Step 5 — Verify:
- Atom count matches
- Charge is conserved in ionic reactions
- Phases look reasonable
- Leftover reactants appear if a limiting reactant situation is shown
—
Worked Example: Combustion at the Particle Level
Equation: CH₄(g) + 2 O₂(g) → CO₂(g) + 2 H₂O(g)
Before: one CH₄ molecule and two O₂ molecules.
After: one CO₂ molecule and two H₂O molecules.
When methane is the limiting reactant in a mixture, you may also show unreacted O₂ after the reaction—exactly what happens in a real mixture. AP questions sometimes test whether you notice leftover reactants, not just the ideal stoichiometric picture.
—
Worked Example: Physical Change (Melting)
Particulate diagrams are not only for reactions.
H₂O(s) → H₂O(l)
Before: water molecules in a fixed, ordered solid arrangement.
After: the same molecules, still close together, but no longer locked in a rigid lattice.
No atoms change identity—only arrangement changes. That distinction helps on questions mixing physical and chemical changes.
—
Seven Mistakes That Cost AP Points
- Unbalanced ratios — drawing three product particles when the coefficient is two.
- Broken molecules — splitting H₂O into separate H and O after the reaction.
- Ionic compounds drawn as molecules in aqueous solution.
- Forgetting diatomic elements — showing lone H or O atoms from reagents that exist as H₂ or O₂.
- Ignoring spectators when the prompt includes them — or drawing spectators that react when they do not.
- Wrong phase layout — ions in a solid drawn far apart like a gas.
- Creating or destroying atoms — the diagram violates conservation of mass.
When you review missed questions, mark which rule broke. Most errors repeat one of these patterns.
—
How Particulate Diagrams Connect to Other AP Topics
Once you are comfortable drawing particles, other units become clearer:
- Net ionic equations: your diagram shows which ions actually collide and form products.
- Limiting reactant: leftover particles in the “after” box match your stoichiometry math.
- Acid–base reactions: H⁺ and OH⁻ combine to form water molecules; remaining ions explain conductivity changes in solution.
- Solubility: you can show ions in solution versus ions locked in a precipitate.
That cross-topic link is why many students work with an online chemistry tutor who focuses on representations—not just memorizing definitions.
—
Study Plan: One Week to Exam-Ready Diagrams
| Day | Focus | Activity |
|---|---|---|
| 1 | Diatomic elements & molecules | Draw 5 simple synthesis reactions |
| 2 | Ionic dissociation | Convert formulas to aqueous ions |
| 3 | Net ionic + precipitates | Ag⁺ + Cl⁻, Ba²⁺ + SO₄²⁻ |
| 4 | Limiting reactant mixtures | Include leftover reactants |
| 5 | Physical changes | Phase change diagrams |
| 6 | Mixed MC practice | Pick the one consistent diagram |
| 7 | Timed FRQ-style sketch | 8 minutes, self-grade with the four rules |
If you are preparing for AP exams in the United States, United Kingdom, Canada, Australia, India, Singapore, or the UAE, the representation skill is the same even when course codes differ. A tutor can adapt examples to your syllabus while keeping the particle rules identical.
—
Quick Reference Checklist (Print This)
Before you submit any particulate diagram, confirm:
- Equation is balanced
- Every atom is accounted for
- Coefficients match particle counts (or a clear reduced ratio)
- Diatomics stay paired
- Polyatomic ions stay intact unless the reaction changes them
- Phases are shown correctly
- Charges balance in ionic systems
- Leftover reactants included if the mixture is not stoichiometric
—
When to Get Help
If you balance equations quickly but diagrams still feel vague, targeted tutoring helps more than rereading the textbook. A good session will:
- Walk through your missed problems
- Build a personal error log (ratios vs. phases vs. ions)
- Connect particulate views to MC and FRQ scoring guidelines
Online tutoring works especially well here because tutors can share a whiteboard, draw before/after boxes live, and repeat variations until the pattern clicks.
—
Final Thoughts
Particulate diagrams are not a separate topic—they are the microscope you use on every other chemistry idea. Learn the four rules, practice with a checklist, and treat every drawing like a proof: if the particles are right, the chemistry is right.
Seed keyword focus: particulate diagrams chemistry
Related skills: AP Chemistry representations, net ionic equations, stoichiometry, phase changes, ionic dissociation.
—
Written for students and parents researching chemistry support. Facts about particulate models reflect standard AP Chemistry learning objectives and widely taught principles of chemical representation; prose is original and intended for study use.